In this report I will provide an overview of my solution to kaggle’s “Titanic” competition. The aim of this competition is to predict the survival of passengers aboard the titanic using information such as a passenger’s gender, age or socio-economic status. I will explain my data munging process, explore the available predictor variables, and compare a number of different classification algorithms in terms of their prediction performance. All analysis presented here was performed in R. The corresponding source code is available on github.

Data munging
The data set provided by kaggle contains 1309 records of passengers aboard the titanic at the time it sunk. Each record contains 11 variables describing the corresponding person: survival (yes/no), class (1 = Upper, 2 = Middle, 3 = Lower), name, gender and age; the number of siblings and spouses aboard, the number of parents and children aboard, the ticket number, the fare paid, a cabin number, and the port of embarkation (C = Cherbourg; Q = Queenstown; S = Southampton). Of the 1309 records 1068 include the label, thus constituting the training set, while a different subset of size 418 does not include the label and is used by kaggle for assessing the accuracy of the predictions submitted.
To facilitate the training of classifiers for the prediction of survival, and for purposes of presentation, the data was preprocessed in the following way. All categorical variables were treated as factors (ordered where appropriate, e.g. in the case of class). From each passenger’s name her title was extracted and added as a new predictor variable.
data$title = sapply(data$name, FUN=function(x) { strsplit(x, split='[,.]')[[1]][2]})
data$title = sub(' ', '', data$title)
This resulted in a factor with a great number of different levels, many of which could be considered similar in terms of implied societal status. To simplify matters the following levels were combined: ‘Mme’, ‘Mlle’, ‘Ms’ were re-assigned to the level ‘Miss’; ‘Capt’, ‘Col’, ‘Don’, ‘Major’, ‘Sir’ and ‘Dr’ as titles of male nobility to the level ‘Sir’; and ‘Dona’, ‘Lady’, ‘the Countess’ and ‘Jonkheer’ as titles of female nobility to the level ‘Lady’.
The number of all family members aboard was combined into a single family size variable. In addition, a categorical variable was formed from this data by assigning records to three approx. equally sized levels of ‘singles’, ‘small’ and ‘big’ families. Also, another factor was added aimed at uniquely identifying big families. To this send each passenger’s surname was combined with the corresponding family size (resulting e.g. in the factor level “11Sage”), but such that families smaller than a certain number (n=4) were all assigned the level “small”.
Age information was missing for many records (about 20%). Since age can be hypothesised to correlate well with such information as a person’s title (e.g. “Master” was used to refer politely to young children), this data was imputed using a random forest (essentially a bagged decision tree) trained to predict age from the remaining variables:
agefit = rpart(age ~ pclass + sex + sibsp + parch + fare + embarked + title + familysize, data=data[!is.na(data$age),], method="anova")
data$age[is.na(data$age)] = predict(agefit, data[is.na(data$age), ])
From the imputed age variable a factor was constructed indicating whether or not a passenger is a “child” (age < 16).
The fare variable contained 18 missing values (17 fares with a value of 0 and one NA), which were imputed using a decision tree analogous to the above method for the age variable. Since this variable was far from normally distributed (which might violate some algorithm’s assumptions), another factor was created splitting the fare into 3 approx. equally distributed levels.
Cabin and tickets information was sparse, i.e. missing for most passengers, and not considered for further analysis or as predictors for classification. The embarkation variable contained a single missing value, for which was substituted the majority value (Southampton).
All of the above transformations were performed on the joined train and test data, which was thereafter split again into the original two sets.
In summary, the processed data set contains the following features. 5 unordered factors: gender, port of embarkation, title, child and family id. 3 ordered factors: class, family size category, fare category. And three numerical predictors: age, fare price and family size (of which only age is approx. normal distributed).
Data exploration
Some background information about the titanic disaster might prove useful to formulate hypotheses about the type of people more probable to have survived, i.e. those more likely to have had access to lifeboats. The ship only carried enough lifeboats for slightly more than half the number of people on board (and many were launched half-full). In this respect, the most significant aspect of the rescue effort was the “women and children first” policy followed in the majority of life boat loadings. Additionally, those on the upper decks (i.e. those in the upper classes) had easier access to lifeboats, not the least because of closer physical proximity than the lower decks. It should thus not come as a surprise that survival was heavily skewed towards women, children and in general those of the upper class.
As a first step let’s look at survival rates as a function of each factor variable in the training set, shown in Figure 1.

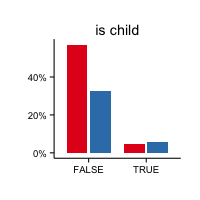
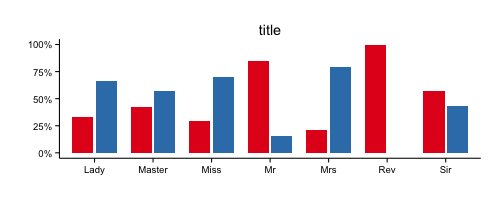
Clearly, male passengers were at a huge disadvantage. They were about 5 times more likely to die than to survive. In contrast, female passengers were almost 3 times more likely to survive than to die. Next, while 1st class passengers were more likely to survive, chances were tilted badly against 3nd class passengers (in the 2nd class the chance was about equal). While a difference in survival rate can also be seen depending on the port of embarkation, the variable is so highly imbalanced that these differences could be spurious. In regards to family size, singles were much more likely to die than to survive. However, this balance is affected highly by the fact that of the 537 singles 411 were male and only 126 female. The gender thus confounds this family size level. When considering only non-singles we see a slight effect of larger families size leading to lower probability of survival. The fare variable essentially mirrors the class variable. Those who paid more for their ticket (and thus probably of a higher socio-economical status) are somewhat more likely to survive than to perish, while passengers with the cheapest tickets were much more probable to die. The title variable mostly confirms the earlier trends. Passengers with female titles (Lady, Miss, Mrs), as well as young passengers (Master) are more likely to survive than adult male passengers (Mr, Sir, Reverend). And amongst the male adults, those of nobility (Sir) had a better chance of survival than “common” travellers (Mr). A slight effect of age on survival can also be seen in the “is child” variable (most children survived, while most adults died), but the number of children was relatively low overall.
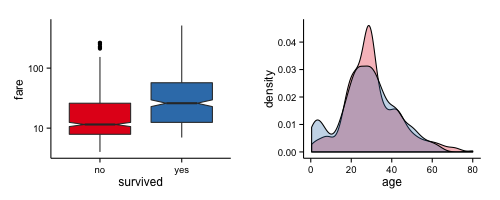
The numeric variables further support the trend observed in the corresponding factors, as can be seen in Figure 2 below.
To develop some intuition about the importance of the different predictors and how they might be used by a classifier it may help to train a simple decision tree on the data, which is a model easy to interpret. Let’s start by sticking mostly to the original predictors (not including non-normal variables converted to factors, nor engineered variables like the title):
dc1 = rpart(survived ~ pclass + sex + age + familysize + fare + embarked, data=train, method="class")
A tree trained on the remaining predictors is shown below in Figure 3.
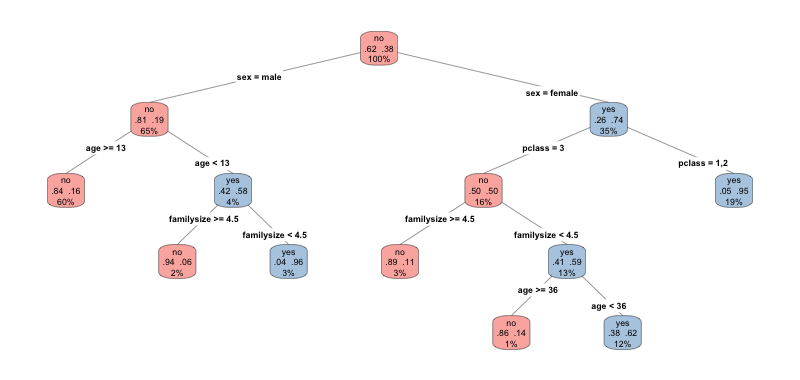
The resulting decision tree should not be surprising. Without any further information (at the root node) the classifier always predicts that a passenger would not survive, which is of course correct given that 62% of all passengers died while only 38% survived. Next, the tree splits on the gender variable. For male passengers over the age of 13 the classifier predicts death, while children are more likely to survive, unless they belong to a large family. On the female branch, those belonging to the upper class are predicted to survive. Those in the third class, in contrast, are predicted to survive only when they belong to a relatively small family (size < 4.5) and are under the age of 36. Those older, or member of a bigger family are more probable to have died. The fare and embarkation variables are not used in the final tree. Since we already know that fare correlates strongly with class, and since embarkation is strongly imbalanced, this is not surprising. “Factorised” variables derived from non-uniformly distributed predictors (fare category, family size category and “is child”) are not required in the training of the tree, as it automatically determines the best level at which to split the variables.
How about the engineered variables of a passenger’s title and familyId? One possible problem here is that these factors contain relatively many levels. Decision trees split nodes by information gain, and this measure in decision trees is biased in favour of attributes with more levels. Regular trees will therefore often produce results with those categorical variables dominating others. However, biased predictor selection can be avoided using Conditional Inference Trees (ctrees), which will be employed later when more methodologically exploring different classifiers.
As a last step, we compare the distribution of variables from the train and the test set, to avoid potential surprises arising from imbalanced splits of the data. Instead of pulling out and displaying here all tables for the categorical variables in both sets, we first use a chi-square test to single out those categorical variables whose levels are differently distributed:
factabs = lapply(varnames[facvars], function(x) { data.frame(cbind(table(train[,x]), table(test[, x])))})
pvals = sapply(faccomp, function(x) chisq.test(x)$p.value)
faccomp[[which(pvals<0.05)]]
Only the embarkation shows a slight but apparently significant difference between the train and test set, with the difference in the proportions of people embarked in Cherbourg vs. Southhamption being slightly less pronounced in the test set (C=0.188, S=0.725 in the training set, and C=0.244, S=0.646 in the test set). Since the overall tendency is preserved we assume this difference will not affect the quality of our following predictions. Comparing five-number summaries for the numerical variables showed no further differences in distribution between the train and test sets.
Classifier training
I decided to use the caret package in R to train and compare a variety of different models. I should note that finding a better way to preprocess, engineer and extend the available data is often more important than small improvements gained from using a better classifier. However, I suspect that since the titanic data set is very small and consists mostly of categorical variables, and since I know of no way to collect more data on the problem (without cheating), some classifiers might in this particular case perform better than others.
The caret package provides a unified interface for training of a large number of different learning algorithms, including options for validating learners using cross-validation (and related validation techniques), which can be used simultaneously for the tuning of model-specific hyper-parameters. My overall approach will be this: first I train a number of classifiers using repeated cross-validation to estimate their prediction accuracy. Next I create ensembles of these classifiers and compare their accuracy to that of individual classifiers. Lastly, I choose the best (individual or ensemble) classifier to create predictions for the kaggle competition. Usually, I would maintain a hold out set for validation and comparison of the various hypertuned algorithms. Because the data set is already small, however, I decided to try and rely on the results from repeated cross-validation (10 folds, 10 repeats). It might nevertheless be insightful to at least compare the cross-validated metrics (using the full data set) to those measured on a holdout set, even when ultimately training the final classifier on the whole training set. We’ll start by training with 20% of data reserved for the validation set.
Here’s my approach to more or less flexibly building a set of different classifiers using caret:
rseed = 42
scorer = 'ROC' # 'ROC' or "Accuracy'
summarizor = if(scorer == 'Accuracy') defaultSummary else twoClassSummary
selector = "best" # "best" or "oneSE"
folds = 10
repeats = 10
pp = c("center", "scale")

cvctrl = trainControl(method="repeatedcv", number=folds, repeats=repeats, p=0.8,
    summaryFunction=summarizor, selectionFunction=selector, classProbs=T,
    savePredictions=T, returnData=T,
    index=createMultiFolds(trainset$survived, k=folds, times=repeats))
First, use a random seed to make results repeatable! Next we select whether to optimise prediction accuracy or the area under the ROC curve, and the number of folds for cross-validation and the number of times to repeat the validation. Some algorithms require normalised data, which means centering and scaling here. Lastly, setup the training control structure expected by the caret package. Next we set up a number of formulas to be used by the classifiers:
fmla0 = survived ~ pclass + sex + age
fmla1 = survived ~ pclass + sex + age + fare + embarked + familysizefac + title
...
fmla = fmla1
No surprise here. Caret accepts parameter grids over which to search for hyperparameters. Here we set these up for our selected algorithms and combine them in a list along with additional model parameters expected by caret (such as a string identifying the type of model etc):
glmnetgrid = expand.grid(.alpha = seq(0, 1, 0.1), .lambda = seq(0, 1, 0.1))
...
rfgrid = data.frame(.mtry = 3)

configs = list()
configs$glmnet = list(method="glmnet", tuneGrid=glmnetgrid, preProcess=pp)
...
configs$rf = list(method="rf", tuneGrid=rfgrid, preProcess=NULL, ntree=2000)
Now that we have a list of training algorithms along with their required parameters, it’s just a matter of looping over it to train the corresponding classifiers:
arg = list(form = fmla, data = trainset, trControl = cvctrl, metric = scorer)
models = list()
set.seed(rseed)
for(i in 1:length(configs))
{
  models[[i]] = do.call("train.formula", c(arg, configs[[i]]))
}
names(models) = sapply(models, function(x) x$method)
Let’s look at some comparisons of the individual classifiers (Table 1):
| glmnet | rf | gbm | ada | svmRadial | cforest | blackboost | earth | gamboost | bayesglm | |
|---|---|---|---|---|---|---|---|---|---|---|
| train | 0.838 | 0.870 | 0.891 | 0.891 | 0.850 | 0.853 | 0.843 | 0.838 | 0.842 | 0.832 |
| val | 0.808 | 0.797 | 0.853 | 0.825 | 0.825 | 0.808 | 0.802 | 0.797 | 0.785 | 0.808 |
The ada and gbm classifiers seems to do best in terms of accuracy, on both the training as well as the validation set, followed by the svm. However, since we have used the area under the ROC curve as the optimized metric it might be more informative to drill down into how the classifiers perform in terms of ROC, specificity and sensitivity.
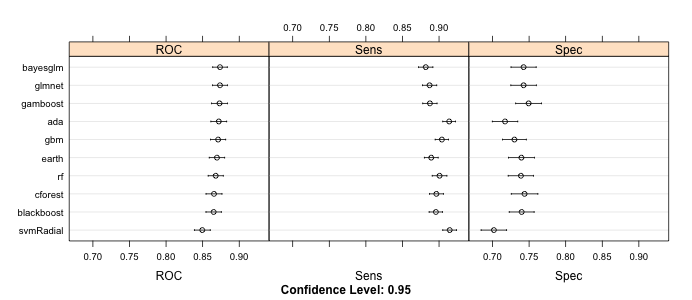
Figure 4 uses the resample results from cross-validation to display means and 95% confidence intervals for the shown metrics. We note that though gbm and ada had the best accuracy on the validation set, there are other models that seem to find a better trade-off between sensitivity and specificity, at least as estimated on the resampled data. More specifically, gbm, ada and svm show relatively high sensitivity, but low specificity. The generalized linear and additive models (glm, gam) seem to do better. Also, while the svm has high accuracy on the validation set and high sensitivity (recall) in cross-validation, i.e. is good at identifying the survivors, it performs worst amongst all classifiers in correctly identifying those who died (specificity).
Finally, let’s create ensembles from the individual models and compare their ROC performance to the models on the validation set. Two ensembles are created with the help of Zach Mayer’s caretEnsemble package (itself based on a paper by Caruana et al. 2004): the first employs a greedy forward selection of individual models to incrementally add those to the ensemble that minimize the ensemble’s chosen error metric. The ensemble’s predictions are then essentially a weighted average of the individual predictions. The second ensemble simply trains a new caret model of choice using the matrix of individual model predictions as features (in this case I use a generalized linear model), also known as a “stack”.
| glmnet | gbm | LogitBoost | earth | blackboost | bayesglm | gamboost | svmRadial | ada | |
|---|---|---|---|---|---|---|---|---|---|
| weight | 0.387 | 0.292 | 0.203 | 0.080 | 0.019 | 0.009 | 0.007 | 0.002 | 0.001 |
| earth | gamboost | blackboost | cforest | bayesglm | glmnet | svmRadial | rf | greedyEns | ada | gbm | linearEns | |
|---|---|---|---|---|---|---|---|---|---|---|---|---|
| ROC | 0.836 | 0.846 | 0.846 | 0.858 | 0.861 | 0.862 | 0.862 | 0.865 | 0.873 | 0.876 | 0.878 | 0.879 |
On the unseen validation set we notice once again that ada and gbm perform best amongst the individual classifiers, not only in terms of accuracy as demonstrated above, but also in terms of the area under the ROC curve. Both, however, are outperformed slightly by the stacked ensemble (linearEns).
Finally, let’s compare the performances on the validation set to those obtained from cross-validated training on the whole training set. Table 3 summarises corresponding metrics for all classifiers:
| glmnet | rf | gbm | ada | svmRadial | cforest | blackboost | earth | gamboost | bayesglm | linearEns | greedyEns | |
|---|---|---|---|---|---|---|---|---|---|---|---|---|
| ROC | 0.871 | 0.875 | 0.877 | 0.875 | 0.864 | 0.871 | 0.866 | 0.869 | 0.873 | 0.870 | 0.880 | 0.878 |
| Sens | 0.879 | 0.910 | 0.892 | 0.897 | 0.923 | 0.908 | 0.890 | 0.883 | 0.876 | 0.871 | 0.894 | |
| Spec | 0.750 | 0.699 | 0.743 | 0.739 | 0.678 | 0.701 | 0.723 | 0.721 | 0.740 | 0.752 | 0.733 |
The results seem to confirm our finding from predictions on the validation set. After training on the whole data set ada and gbm exhibit the best cross-validated ROC measures, but the ensemble classifiers do even better.
Conclusions
Based on an assessment of the area under the ROC curve, on both a validation subset of the data as well as repeated cross-validation on the whole set, boosted classification trees (ada and gbm) seem to perform best amongst single classifiers on the titanic data set. Ensembles built using a range of different classifiers, in particular in the form of a stack, lead to a small but seemingly consistent improvement over the performance of individual classifiers. I therefore chose to submit the predictions of the generalized linear stack. Interestingly, this did not lead to my best submission score. The ensemble has an accuracy of 0.78947 on the public leaderboard, i.e. on the part of the test set used to score different submissions. In comparison, I’ve also trained a single forest of conditional inference trees using the familyid information as an additional predictor, which obtained an accuracy score of 0.81818 and ended up much higher on the leaderboard. Now, kaggle leaderboard position in itself doesn’t always correlate well with final performance on the whole test set, essentially because of overfitting to the leaderboard if many submissions are made and models selected on the basis of achieved position. Nevertheless, before the end of the competition it might be worth comparing the above classifiers and ensembles with different formulas (combinations of predictors, including family identifiers). Another option is to perform the full training again with accuracy rather than AUC as the optimized metric, which is the one used to assess predictions by kaggle in this competition. However, as have commented many kagglers involved in past competitions, it is probably better to rely on one’s own cross-validation scores, rather than potentially overinflated leaderboard scores, to predict a model’s final success.