The ubiquity of mobile phones equipped with a wide range of sensors presents interesting opportunities for data mining applications. In this report we aim to find out whether data from accelerometers and gyroscopes can be used to identify physical activities performed by subjects wearing mobile phones on their wrist.

Methods
The data used in this analysis is based on the “Human activity recognition using smartphones” data set available from the UCL Machine Learning Repository [1]. A preprocessed version was downloaded from the Data Analysis online course [2]. The set contains data derived from 3-axial linear acceleration and 3-axial angular velocity sampled at 50Hz from a Samsung Galaxy S II. These signals were preprocessed using various filters and other methods to reduce noise and to separate low- and high-frequency components. From this data a set of 17 individual signals was extracted by separating e.g. accelerations due to gravity from those due to body motion, separating acceleration magnitude into its individual axis-aligned components and so on. The final feature variables were calculated from both the time and frequency domain of these signals. They include too large a range to cover entirely here, but examples include variables related to the spread and centre of each signal, its entropy, skewness and kurtosis in frequency space and many more.
All data was recorded while subjects (age 19-48) performed one of six activities and labelled accordingly: lying, sitting, standing, walking, walking down stairs and walking up stairs.
The problem to be solved in our analysis is the prediction of the activity class from sensor data. Since we are only interested in prediction, and not in producing an accurate or easily comprehensible model of the relation between activity and sensor data, we have chosen to investigate the performance of the following three classifiers only: random forest (RF), support vector machine (SVM) and linear discriminant analysis (LDA). A short description of each algorithm is given in the next sections.
In order to assess and compare the performance of these classifiers we separated the data into a training and a test set. The latter consisted of data for subjects 27 to 30 and the former of the remainder.
Random forests
Random forests are a recursive partitioning method [3]. In the case of classification, the algorithm creates a set of decision trees calculated on random subsets of the data, using at each split of a decision tree a random subset of predictors. The final prediction is made on the basis of a majority vote across all trees. Random trees have been chosen for this analysis in part because of their accuracy and their applicability to large data sets without the need for feature selection.
Because the trees in random forests are already build from random subsamples of the data, they do not require cross-validation to estimate accuracy, and the OOB (out-off-bag) error calculated internally is generally considered a good estimator of prediction error. They also do no require the tuning of many hyper-parameters. The algorithm is not sensitive, for example, to the number of trees fitted, as long as that number is greater than a few hundred. However, some have reported variation in performance depending on the proportion of variables tested at each split. We therefore tuned this parameter using a monotonic error reduction criterion which searches for performance improvement to both sides of the default value (the square root of the number of variables, approx. 23 in this case). Using the best identified value we then trained a final random forest for prediction.
Random forests conveniently can provide a measure of each predictor’s importance. This is achieved by comparing the performance of the tree before and after shuffling the values of the variables in question, thereby removing its relation with the outcome variable.
Support vector machines
Support vector machines (SVMs) classify data by separating it into classes such that the distance between their decision boundaries and the closest data points is maximised (i.e. by finding maximum margin hyperplanes) [4]. The algorithm is based on a mathematical trick that involves the use of simple linear boundaries in a high-dimensional non-linear feature space; without requiring computations on this complex transformation of the data. The mapping of the feature space is done using kernel functions, which can be selected based on the classification problem. The data is then modeled using a weighted combination of the closest points in transformed space (the support vectors).
Here we use the SVM classifier provided in the e1071 package for R [5]. For multiclass problems this algorithm performs a one-against-one voting scheme. We chose the default optimization method “C-classification”, where the hyper-parameter C scales the misclassification cost, such that the higher the value the more complex the model (i.e. the larger the bias). We also chose to use the radial basis kernel, which is commonly considered a good first choice. The cost parameter C, along with γ, which defines the size of the kernel (the spatial extent of the influence of a training example), was tuned using grid-search [6] with 10-fold cross validation (tuning function provided in e1071 package).
Linear discriminant analysis
Linear discriminant analysis (LDA) is similar to SVM in that it also tries to transform the problem such that classes separated by non-linear decision boundaries become linearly separable [4]. Instead of using kernels and support vectors, however, it identifies a linear transformation of the predictor variables (a “discriminant function”) that allows for more accurate classification than individual predictors. Identification of the transformation is based on the maximisation of the ratio of between-class variance to within-class variance. The transformation thereby maximises the separation between classes.
Combination of classifiers
We evaluate the performance of each classifier using its error rate (the proportion of misclassified data) or equivalently its accuracy (proportion of correctly classified data). We then combine all three methods using a simple majority vote on the prediction set.
Results
The data set contains 7352 observations of 561 features (in addition to a subject index and the activity performed). Of the 21 subjects included in the data, the last four were used only for evaluating the final performance of the algorithms (test set, 1485 observations) and the rest for training (5867 observations). The same sets were used for all classifiers unless stated otherwise. Data was reasonably distributed across activities (number of data points in each class: lying=1407, sitting=1286, standing=1374, walk=1226, walking down stairs=986, walking up stairs=1073). Since the classifiers used here do not make strong assumptions about the distribution of data (they are relatively robust), no detailed investigation of the statistical properties of individual features was performed. In particular, the methods employed did not require transformations of individual features (e.g. such as to improve normality of their distribution). However, as can be expected from the fact that all features derive from the same few sensor signals, the data exhibits high collinearity. While this would have led to problems with confounders in e.g. a regression model, this was not generally the case with the methods employed here. It was addressed explicitly for the LDA however (see below).
We first report results from individual classifiers and then their combination.
Random Forest
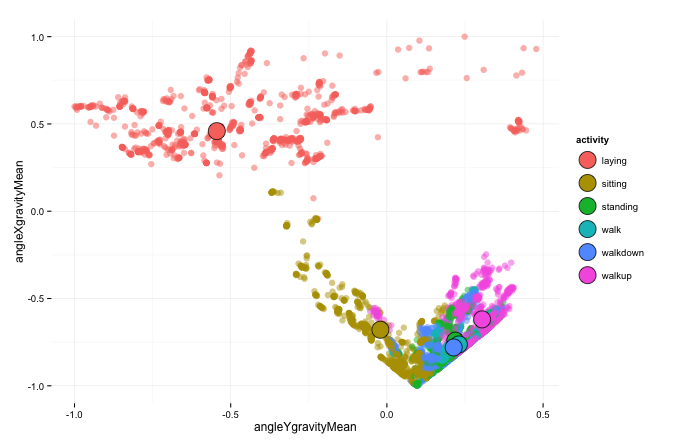
We tuned the proportion of variables considered in each split using 100 trees for each evaluation. The best value found was 20. A final random forest was then trained using the optimal value and 500 trees. Error rate remained low (< 5%) and stable after about 250 trees had been added. Analysis of variable importances, considering both the mean decrease in accuracy and Gini index, shows that the most significant variables are related to the acceleration due to gravity along the X and Y axes, as well as the mean angle with respect to gravity in the same directions (with corresponding measures from the time domain).
Figure 1 shows the data, color-coded by activity, in the first two dimensions identified. We can see that several activities are already well-separated in these two dimensions, but others (standing, walk and walk-down) are largely overlapping.

The error rate of the fitted RF is 1.6% on the training set and 4.6% on the test set (accuracy of 0.954). The confusion matrix of the predicted activities (Table 1) shows that misclassification is almost exclusively due to an inability to distinguish sitting from standing. For example, while precision is greater than 0.977 for all other activities, it is 0.912 and 0.876 for sitting and standing respectively. Apparently the activities showing large overlap in the two most important dimensions (see Figure 1) can easily be separated taking into account other variables, while for sitting and standing activities this is not the case.
| lying | sitting | standing | walking | walk down | walk up | precision | |
|---|---|---|---|---|---|---|---|
| lying | 293 | 1.0 | |||||
| sitting | 227 | 22 | 0.9116 | ||||
| standing | 37 | 261 | 0.8758 | ||||
| walking | 228 | 2 | 1 | 0.9870 | |||
| walk down | 194 | 1 | 0.9949 | ||||
| walk up | 1 | 4 | 214 | 0.9772 | |||
| sensitivity | 1.0 | 0.8598 | 0.9223 | 0.9956 | 0.97 | 0.9907 | accuracy=0.954 |
The accuracy of the random forest can be appreciated when comparing the actual activities in the test set with those predicted by the model. Figure 2 below plots for the two most important variables the conditional density plots of both actual and predicted activities. In each panel the density plot shows the frequency of each activity as a function of the given variable. Clearly, at least in the two chosen dimensions, the model’s predictions match the actual distribution of activities very closely.

Support Vector Machine
Tuning of SVM hyper-parameters using the training set resulted in optimal values of the cost C = 100 and kernel size γ = 0.001 (search was performed in intervals γ ∈ [1e-6, 0.1] and C ∈ [1,100]). To reduce computation time, the search was performed on a fraction (20%) of data randomly sampled from the training set. Using these optimal values a final SVM was trained on the whole set.
The resulting SVM uses 22.6% of the data points as support vectors (1326 out of 5867). Since this number depends on the tuned parameter C, which was found using cross-validation, we assume that we have not overfit the model. This is supported by the model’s high accuracy of 0.989 on the training set when averaged over a 10-fold cross validation. On the test set its accuracy is 0.96, i.e. slightly better than the random forest.
The confusion matrix of predictions is shown in Table 2. As we can see, the SVM exhibits perfect classification for all activities other than sitting and standing, where its performance is similar to the random forest.
| lying | sitting | standing | walking | walk down | walk up | precision | |
|---|---|---|---|---|---|---|---|
| lying | 293 | 1.0 | |||||
| sitting | 232 | 27 | 0.8958 | ||||
| standing | 32 | 256 | 0.8889 | ||||
| walking | 229 | 1.0 | |||||
| walk down | 200 | 1.0 | |||||
| walk up | 216 | 1.0 | |||||
| sensitivity | 1.0 | 0.8788 | 0.9046 | 1.0 | 1.0 | 1.0 | accuracy=0.96 |
Linear Discriminant Analysis
LDA can be sensitive or even fail when the data exhibits a high degree of collinearity. Since our sensor data essentially consists of different transformations of the same few signals we can expect that this is indeed the case in our data set. We therefore performed two LDA classifications. For the first model (LDA1) the complete training set was used. For the second model (LDA2) we removed those variables that exhibited pair-wise correlations greater than R=0.9 (removing one from each pair) using the findCorrelation function in R’s caret package. A total of 346 variables were thus removed, leaving 215 less correlated predictors. Using these two training sets, LDA models were trained with 10-fold cross validation to assess whether we would expect a difference in their accuracy. The LDA2 model, trained on relatively uncorrelated data, showed an error rate of 3.5%, and LDA1 a rate of 5.2%. Based on these results we have to conclude that LDA2 should be used for our final predictions.
Table 3 shows the confusion matrix for the LDA2 model when predicting on the test set.
| lying | sitting | standing | walking | walk down | walk up | precision | |
|---|---|---|---|---|---|---|---|
| lying | 293 | 1.0 | |||||
| sitting | 223 | 24 | 0.9028 | ||||
| standing | 41 | 259 | 0.8633 | ||||
| walking | 226 | 3 | 2 | 0.9784 | |||
| walk down | 196 | 1.0 | |||||
| walk up | 3 | 1 | 214 | 0.9817 | |||
| sensitivity | 1.0 | 0.8447 | 0.9152 | 0.9869 | 0.98 | 0.9907 | accuracy=0.95 |
We can observe the same pattern of misclassification as in the other two models. Interestingly, when we use LDA1 for prediction, accuracy is increased to 0.9785 (error rate of 2.15%). Nevertheless, since in cross-validation on the training set LDA2 performed better, we assume that this increase is a result of chance only and does not reflect a truly better model.
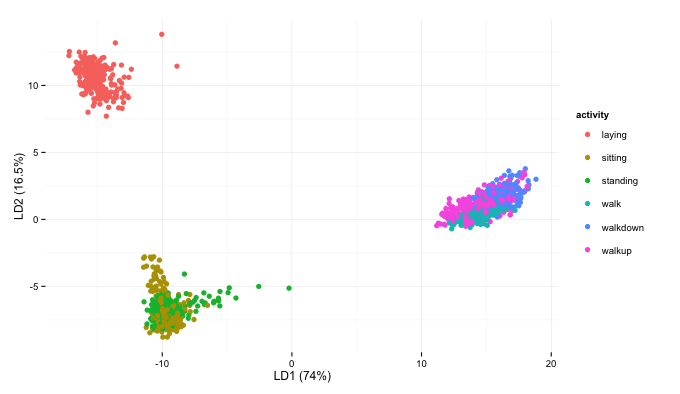
To visually demonstrate the reason for the model’s misclassification we can plot the test data in the first two dimensions of the trained linear discriminant, color-coded by true activity (Figure 3).

Again, we find that two clusters of activities are similar: sitting and standing on the one hand, and the different walking activities on the other. But at least the two clusters (as well as the data points for the lying acticity) are well separated, in contrast to the “raw” dimensions shown in Figure 1.
Comparison of classifiers
Comparing the three classifiers in terms of their sensitivity (recall), i.e. the proportion of correct predictions for each class, we have already seen that all three models perform very similar, with the SVM having a slight advantage. We can speculate that this is due to the non-linear (radial basis) decision boundaries of the classifier, which stands in contrast to the linear methods employed in the other two models.
Based on the previous results we expect not to gain much predictive power from the combination of individual models using a simple majority vote. All models exhibit the same problem of misclassification of sitting and standing activities, and therefore do not complement each other. This is confirmed by a combined accuracy of 0.958 when predictions are made based on a majority vote of the three models, which sits exactly between the lower scoring RF and LDA on the one hand, and the slightly higher scoring SVM on the other.
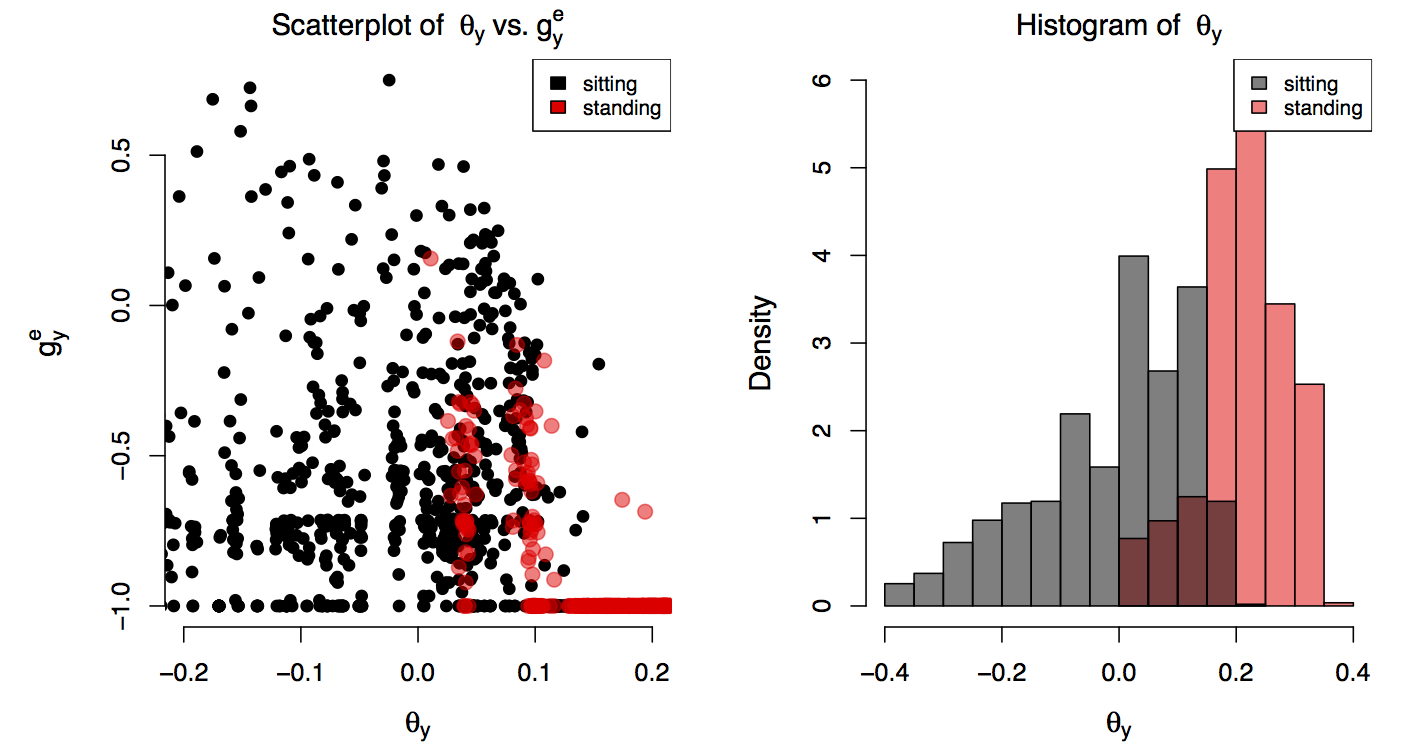
What explains the consistent misclassification of sitting and standing across all three models? Intuitively it is clear that since in both “activities” subjects remain more or less motionless, inertial data will not provide much differentiating information. This is reflected in the data. To illustrate this we trained another random forest on a new subset of the training data which a) included only sitting and standing activities, and b) only included predictors with pair-wise correlations less than R=0.9 (same procedure as for the LDA model). This data set therefore consisted of a binary outcome and 2113 observations (1022 and 1091 in each level). The importances of the resulting random forest show that the most significant split is achieved on the mean angle of gravity with respect to the Y axis (θy), followed by the energy measure of acceleration due to gravity in the Y dimension in the time domain (gey) or, according to the mean decrease in Gini index, the entropy measure of the same variable. In the left panel of Figure 1 we plot the data along these two axes (θy vs. gey) and color the data according to activity.

We can see that while the data falls into two identifiable regions, these are not perfectly separable but rather show significant overlap. This can be seen even more clearly in the right panel of Figure 1, where we overimpose histograms of θy separated by activity. The distributions of sitting and standing in this variable are clearly different statistically, but also overlap significantly. Their difference is confirmed by a t-test of their means (-0.01 and 0.21 for sitting and standing respectively, p– value < 2.2e-16). Nevertheless, the overlap means that no classifier should be able to distinguish these two activities perfectly, at least not based on this single variable. Adding further variables might help in separating the two distributions. But as the three trained models seem to indicate, the data set does not appear to contain the kind of variables that allows for perfect discrimination of sitting and standing.
Conclusions
We have used three different types of classifiers to predict a subject’s physical activity from inertial data captured using the accelerometer and gyroscope embedded in mobile phones worn at the wrist. All classifiers performed well overall (accuracy > 0.95), but failed equally to distinguish some cases of sitting and standing. We observe, however, that the non-linear SVM seems to have a slight advantage over the two linear models. This suggests that perhaps a non-linear variant of the LDA algorithm (namely quadratic discriminant analysis, or QDA), and equally a random forest using decision trees with non-linear boundaries, would have been more appropriate for this data set. Further work would also be needed to determine whether the radial kernel used in the SVM model is in fact the optimal kernel for this data set.
We have shown that the data used in this analysis does not seem to contain individual variables that can separate sitting and standing activities perfectly. The failure of all three classifiers also suggests that the two activities cannot be resolved in higher dimensions. This is corroborated by the fact that the classifiers all take rather different approaches, e.g. parametric (LDA) and non-parametric (RF), or linear (decision trees) and non-linear decision boundaries (SVM). Of course, the failure to distinguish sitting and standing using inertial data only is not surprising, as both activities imply near stationarity of the sensors. However, we can hypothesise that other transformations of the data not provided in this set could be helpful. E.g. accelerations in the vertical direction due to body motion should show non-linear step changes at the moment of sitting down, while this would not be the case if a person continued standing. Adding the existence of such step-changes to the data set could potentially lead to better separability of these activities.
We have not here performed an analysis of variation between subjects. It is possible that the behaviour of some subjects differs significantly from that of others, and that in the process of “averaging” across subjects information is lost. Future work should also address this question.
References
- UCI Data set: Human Activity Recognition Using Smartphones
- Preprocessed data set on Amazon S3 storage.
- Breiman, L. (2001), Random Forests, Machine Learning 45(1), 5-32.
- Bishop, C. M.(2006). Pattern recognition and machine learning (Vol. 4, No. 4). New York: Springer.
- SVM package ‘e1071’
- Bergstra, J. and Bengio, Y. (2012). Random Search for Hyper-Parameter Optimization. J. Machine Learning Research 13: 281—305.