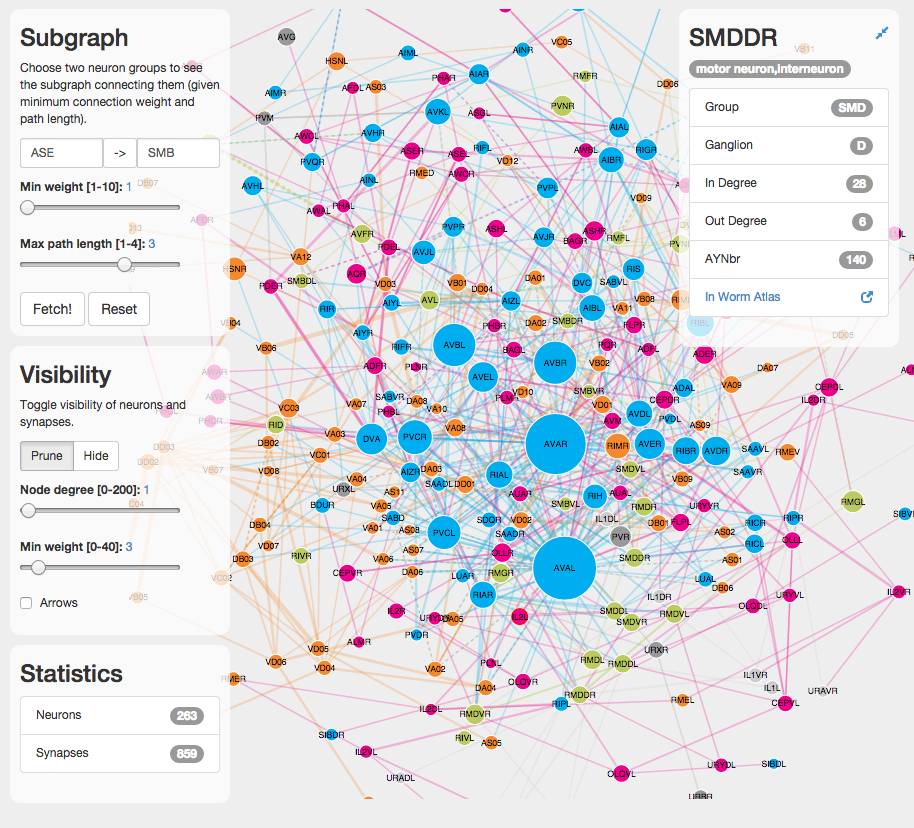
I’ve added a new PubMed search feature to Elegans, the visual worm brain explorer. The idea here is to show the network of C. Elegans neurons that get mentioned in more than n papers on PubMed, in the context of a given search query. So, for example, if one is interested in the worm’s chemotaxis behaviour, one would type in ‘chemotaxis’ and choose the citation threshold n. Initiating the search will then return the neurons that get mentioned in at least n papers along with the word ‘chemotaxis’. The search is in fact performed once for each neuron …
Articles with the d3 tag
Tag graph plugin for Pelican
On my front page I display a sort of sitemap for my blog. Since the structure of the site is not very hierarchical, I decided to show pages and posts as a graph along with their tags. To do so, I created a mini plugin for the Pelican static blog engine. The plugin is essentially a sort of callback that gets executed when the engine has generated all posts and pages from their markdown files. I then simply take the results and write them out in a json format that d3.js understands (a list of nodes and a list …
C. elegans connectome explorer
I’ve build a prototype visual exploration tool for the connectome of c. elegans. The data describing the worm’s neural network is preprocessed from publicly available information and stored as a graph database in neo4j. The d3.js visualization then fetches either the whole network or a subgraph and displays it using a force-directed layout (for now).

Dash+ visualization of running data
Dash+ is a python web application I built with Flask, which imports Nike+ running data into a NoSQL database (MongoDB) and uses D3.js to visualize and analyze it.
The app is work in progress and primarily intended as a personal playground for exploring d3 visualization of my own running data. Having said that, if you want to fork your own version on github, simply add your Nike access token in the corresponding file.
