In this post I will look at linear regression to model the process determining interest rate on peer-to-peer loans provided by the Lending club. Like other peer-to-peer services, the Lending Club aims to directly connect producers and consumers, or in this case borrowers and lenders, by cutting out the middleman. Borrowers apply for loans online and provide details about the desired loan as well their financial status (such as their FICO score). Lenders use the information provided to choose which loans to invest in. The Lending Club, finally, uses a proprietary algorithm to determine the interest charged on an applicant’s loan. Given the secret nature of this process, a borrower or lender might be interested in which variables, beside the obvious FICO credit score, influence the final interest rate and how strong this influence is. It is the aim of this analysis to identify such associations. The goal of the regression modelling is therefore more inferential than predictive.

Methods
Data about peer-to-peer loans issued through the Lending Club was provided by the Data Analysis class on Coursera (file here). The set used in this analysis was downloaded on the 17th of February, 2013. After accounting for missing values in the data, an exploratory analysis was performed to identify variables that required transformation prior to statistical modeling (boxplots, histograms etc.), and to find a subset of variables to be used in a regression model relating interest rate to an applicant’s FICO score (using correlation analysis and PCA). The statistical model itself was a simple linear multivariate regression [1]. Since most variables were not normally distributed, results were also compared to robust estimation techniques.
To reproduce the results of this report the complementary R script (provided on github) can be run with the corresponding data file.
Summary of data
Besides a loan’s interest rate, the data set analyzed here contains information about the amount requested and the amount eventually funded by investors (1000$-35000$), the length of the loan (36 or 60 months), and its purpose (the majority went towards debt consolidation or to pay off credit cards). Information about the applicant included his or her duration of employment, state of residence, information about home ownership (the majority either renting or having a mortgage), debt to income ratio, monthly income, FICO score, number of open credit lines, revolving credit balance, and the number of inquiries made in the last 6 months. In total the set included information about 2500 loans, out of which 79 contained missing data (most in employment length). Given this relatively small number, and the relatively large set, the corresponding data was simply discarded.
FICO scores were transformed from a 38-level factor (the lowest being [640-644] and the highest [830-834]) to mean values for each range. The number of recent loan inquiries showed a Poisson- or exponential-like distribution. Since the kinds of analyses performed on the data—such as linear regression—might be sensitive to data not being normally distributed, we created a new factor variable with only two levels: 0 inquiries (1213 data points) and 1-9 inquiries (1208 data points).
Histograms of quantitative variables indicated that the distributions of monthly incomes, FICO score, revolving credit balance and number of open credit lines were not normal, and more specifically right-skewed to different degrees. While log10 transformation generally brought the distributions closer to normal (at least visually), the results of a Shapiro test [2] indicated that the null-hypothesis of normal distribution still needed to be rejected. Inspection of normal QQ-plots, however, indicated fairly normal distributions across a wide range centered around the means of most variables. While removal of outliers (e.g. monthly incomes greater than 4 or 5 standard deviations from mean) further improved normality, in the remaining analysis the whole data set was used.
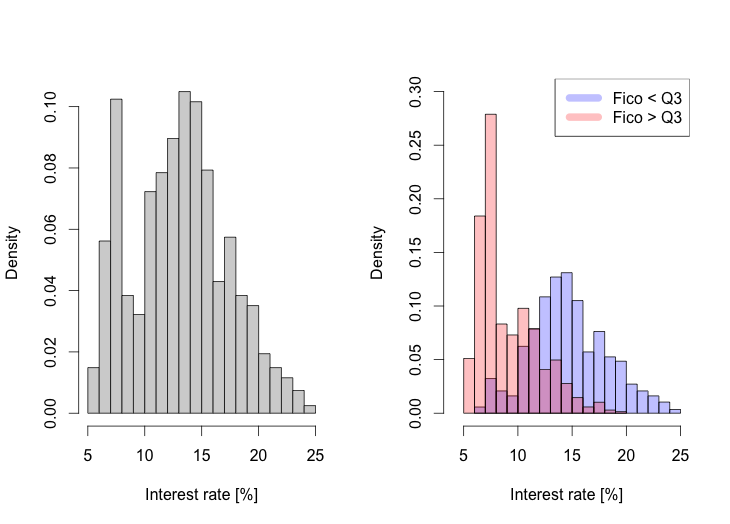
The histogram of the interest rate variable showed a bimodal distribution, suggestive of a superposition of two separate distributions (see Figure 1, left). While none of the factors separated these, when interest rate histograms were plotted for different ranges of the FICO variable (by cutting the latter at quantiles) two more normal-like distributions could be identified (Figure 1, right). The shift in interest rate mean as a function of FICO score indicates that for very high FICO scores, relatively low interest rates become disproportionally more probable.

Exploratory analysis
Since intuitively we know that interest rate should correlate strongly with FICO scores, we examined the associations between the two, as well as those between either and third variables.
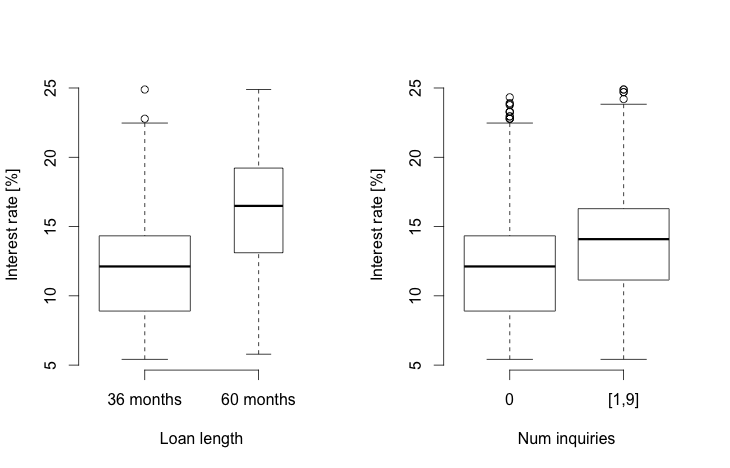
Box plots of interest rate and FICO scores by factor variables showed that only two factors seemed to influence these variables. Loan length had a significant effect on interest rate (p-value of t-test < 2.2e-16, effect size of 4.24%), but not on FICO scores (p-value=0.41). The number of inquiries (two-level factor) had significant effects on the means of both variables (p < 2.2e-16 and p = 1.6e-5), but the effect size was interesting only in the case of interest rate (1.6%). The latter effect comes at no surprise, given that a previous inquiry indicates previous rejection of credit application, itself a sign of reduced credit-worthiness. The effect of loan length and number of credit inquiries on interest rates is summarized in Figure 2 below.

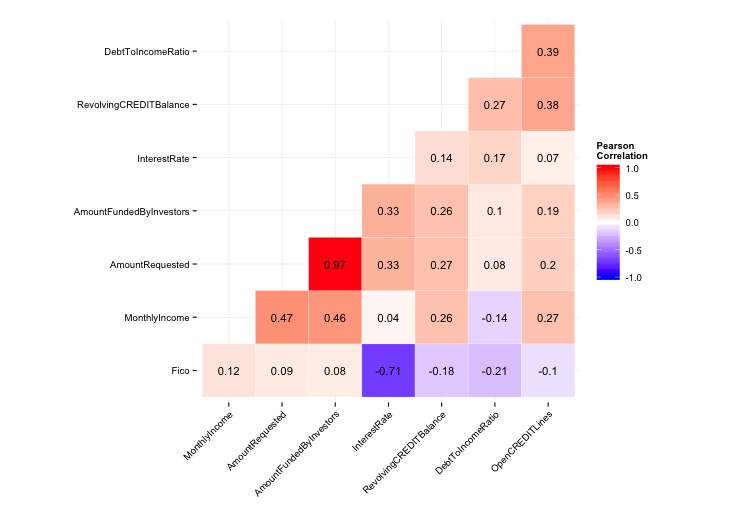
Using their correlation matrix, as well as pair-wise scatter plots with linear models fitted, we aimed to reduce the set of quantitative variables by discarding those (except interest rate and FICO score) that showed high correlations amongst themselves. The correlation of quantitative predictors is shown in Figure 3.

First we eliminated the amount funded by investors. This is justified as a) we are interested here only in the resulting interest rate, not the size of the eventual loans, and b) for most applications the eventual loan equalled the amount requested, i.e. a strong linear relationship (with slope 1) existed between the two (linear regression resulted in adjusted coefficient of determination R2=0.94, i.e. approx. 94% variance explained).
The correlation matrix further showed an association between monthly income and loan amount requested (Pearson correlation R = 0.47; linear regression with adj. R2 = 0.23 and p < 2.2e-16). This is not surprising as we would expect people with higher incomes to be able to afford larger loans. To avoid confounders we also rejected monthly income as an independent variable in further models.
Of the remaining four covariates (excluding FICO), three are related to the applicant’s current debt. In particular, correlation analysis revealed that the number of open credit lines correlates (relatively weakly) with both debt to income ratio (R = 0.38) and revolving credit balance (0.34). We therefore use only the first to stand in for the overall debt burden.
In summary, we consider as quantitative covariates in the statistical model only the amount requested, open credit lines and the FICO score. A PCA analysis confirms that these are indeed relatively independent (see Figure 1). The variable for open credit lines is aligned mostly with the first principal component, FICO score with the second, and the amount requested falls in between the other two (i.e. they are not orthogonal, but far from parallel in the space of the principal components).

In addition we see that loans of different duration are slightly but significantly separated in PCA space. Longer loans can usually be found in the direction of larger amounts and higher FICO score, for example. A PCA using all covariates (not shown) confirms our above finding that monthly income and the amount requested largely capture the same variance in the data (the projections in PCA space are almost parallel), further justifying our exclusion of the former. Equally, the number of open credit lines approx. captures the same variance as the revolving credit balance. Finally, debt to income ratio in PCA space is almost parallel but points in the opposite direction from FICO score, indicating that the former is probably a strong determining factor in the computation of the latter and can therefore also be excluded without losing much of the observed variance.
The exploratory analysis can be summarised by the following relationships between interest rate and retained covariates:
Factors:
- The longer the loan, the higher the interest.
- The more often an applicant has recently inquired about a loan, the higher its interest.
Quantitative:
- The larger the loan, the higher its interest.
- The smaller the FICO score, the higher the interest.
- The higher the number of open credit lines, the higher the interest.
In the following section we aim to quantify these associations in more detail using statistical modeling.
Statistical Modeling
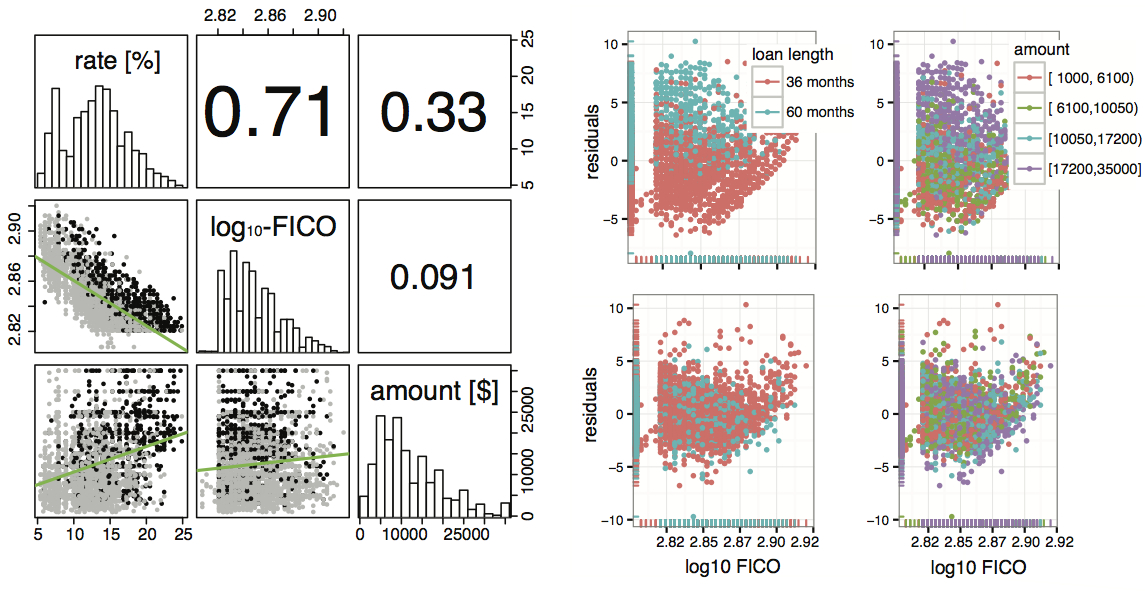
As a first test, a simple linear regression was performed relating interest rate to log10- transformed FICO scores only, as these two variables exhibited the greatest correlation (R=0.71). Analysis of the residuals showed non-random patterns as a function of both the requested amount and loan length, but not the number of open credit lines or number of recent inquiries. We therefore chose to include the first two as potential confounders in a more complicated model:
where IR is the interest rate; the intercept LL36 corresponds to the estimated mean of interest rates for loans over a 36 months period given a FICO score of 1 (log10(1)=0); b1 represents the change in interest rate associated with a change of 1 unit in log10 FICO score for loans of the same amount; b2 captures the change in interest rate as a function of the loan amount requested; b3 the increase in interest rate of loans lasting 60 rather than 36 months; and e are unmodelled random variations. A scatterplot matrix illustrates the relationship between these covariates (Figure 2, left panel).

As can be be seen in the right panel of Figure 2, the full model largely removes the patterns in residuals observed in the simple model. Further analysis also reveals that the residuals are approximately normal in distribution (see Figure 3), indicating that at least this assumption of the linear regression approximately holds.

Whereas the simple model accounted for only 50.65% of the variance in the data, the full model captured 75.18% (R2=0.75, the significance of associations being p < 2.2e-16). The added covariates did not however change the sign nor much the value of the resulting coefficients (LL36=427.3, b1=-146.2, b2=0.00014, b3=3.3). The coefficient measuring the influence of the Fico score, for example, changed by 4% only. We also checked whether inclusion of the number of open credit lines, the number of recent inquiries, or the debt to income ratio in the model would improve the result even further. But the change in explained variance was small (+2.2%) after adding these measures of debt burden. Again coefficients did not change significantly either, indicating that the additional variables do not act as confounders of FICO score, which was a possibility since debt burden is already taken into account in the determination of the FICO score. Allowing for interactions between covariates in the full model also did not result in better fit. Since the distributions of most variables in the data set were not perfectly normal even after transforming (see histograms in Figure 2), we also tested whether non-linear and robust forms of regression would perform better. But neither a generalized linear model (glm in R [2]) nor a robust regression using an M-estimator (rlm in R [3]) produced significantly different coefficients.
In the final model, a change of one unit in log10 FICO score corresponds to a change of -146.2% (95% confidence interval: -142,-152) in interest rate over the base rate of 427.3% (CI: 416, 438). So for example, the interest rate for a 10000$ loan over 36 months would be 12.1% for the average reported FICO score of 707, and would decrease by 0.89% for an additional 10 points of the FICO score. An increase in the size of the loan by 1000$ corresponds to an increase of 0.14% in interest rate (CI of b2: 0.00013, 0.00015). Increasing the length of the loan to 60 months would result in an additional 3.3% of interest (CI: 3.1, 3.52).
Conclusions
Our results show a significant negative association between interest rates and FICO score, modulated by positive associations with loan amount and duration. Due to the log10 transformation, model estimates are non-linear with respect to FICO score. Though this makes interpretation of the model less intuitive, the associations are in the direction one would expect.
It should be kept in mind that the analysis only applies to the peer-to-peer loans issued through the Lending Club. Loans in general, e.g. those offered by traditional banks, might follow a different pattern. While the model presented here would allow interested individuals to get an idea of what interest rates to expect given a desired loan and credit history, further work would be needed if accurate predictions are required (e.g. when evaluating what kind of loans to include in a lender’s portfolio). Also, the data analyzed here does not serve to verify whether peer-to-peer loans provided through the Lending Club are indeed cheaper than those offered by banks, as the website claims.
The main goal of the regression modelling was inferential, identifying significant associations between dependent variables describing the loan applicant and resulting interest rate. In this regard, we have found that FICO score, loan length and requested amount are not confounders, even though it is certainly true that applicants with better FICO score can afford, and often will apply for larger loans. Also, additional measures of debt burden do not ncessarily act as confounders for FICO score, even if they’re likely to be determining factors in the calculation of the latter (if the goal was accurate prediction of interest only, inclusion of these additional variables would likely lead to small increases in performance though). More work would have to be done to provide a complete causal story (such as randomized tests, or stratified analysis) for the determination of interest rate.
As noted, none of the variables in the data set were normally distributed, something that could not be remedied by log transformation (or indeed other transforms, such as square roots etc.). It is possible that other non-linear or robust methods would have been more appropriate. Nevertheless, residuals after linear regression, according to histograms and QQ-plots, were approximately normal, indicating that a linear regression might not have been totally unwarranted.
References
- Bishop, C. M.(2006). Pattern recognition and machine learning (Vol. 4, No. 4). New York: Springer.
- Wood, Simon (2006). Generalized Additive Models: An Introduction with R. Chapman & Hall/CRC.
- J. Huber (1981) Robust Statistics. Wiley.